

This is following from the article Part I. The next two parts will explore the fundamental changing dynamics for renters and landlords. Highlighting the current problems quantitatively. These problems will be wrapped up with policy solutions at the end of this series.
Renters
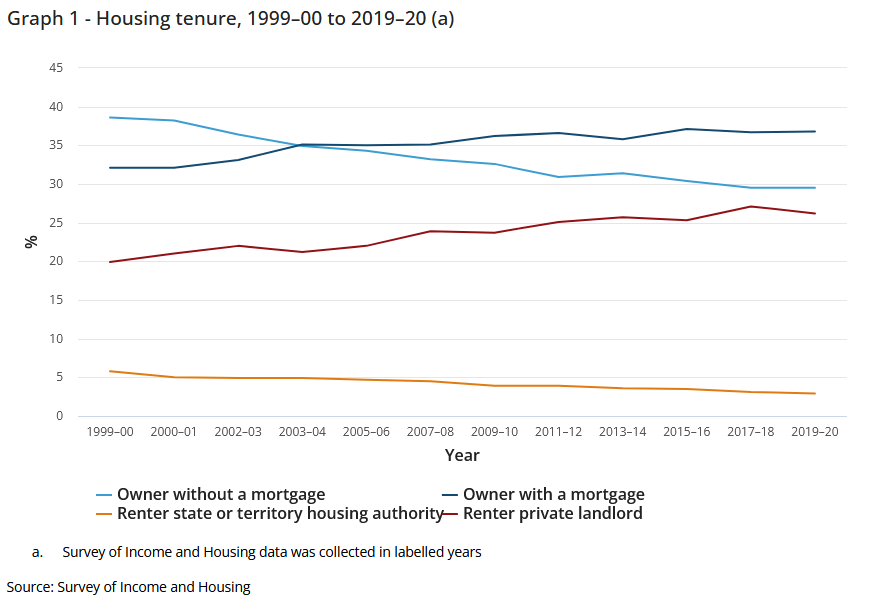
Renters in Australia face the worst market in the world. Renting has shifted from a prelude of home ownership to a long term permanent situation. Nearly 45% of renters have been renting for ten years or more of which only 19% of renters in 2022 reported they prefer to rent. The percentage total amount of households renting has also increased. Between 1999–00 and 2019–20, the percentage of Australian households that rent their home..
- From all landlord types increased from 27% to 31%.
- From A private landlord increased from 20% to 26%.
- From A state or territory housing authority decreased from 6% to 3%.
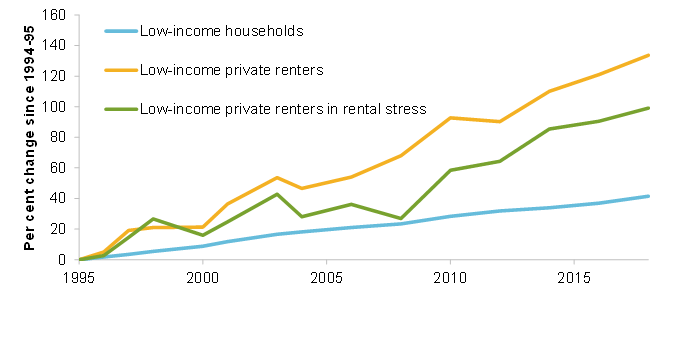
41% of these renters plan to buy homes. Of that 41%, 23% are single middle aged woman, 19% are individuals with disability pensions and 30% are single parents. Note, this is out of the sample of those "planning to buy homes," not "wanting to buy a home," or "thinking about buying a home." The productivity commission research paper found the proportion of low-income households renting privately increased nearly doubled from 16 per cent in 1994-95 to 27 per cent by 2017-18. Note this is laggard data now over six years old. Rates of homelessness and marginalized housing have also increased. Two-thirds spend more than 30 per cent of their income on rent — the commonly used benchmark for identifying 'rental stress' — and many spend much more. 170,000 households have less than $250 available each week after paying rent.
Source - Productivity Commission estimates using ABS
Median household rent as a percentage of median income is skyrocketing.
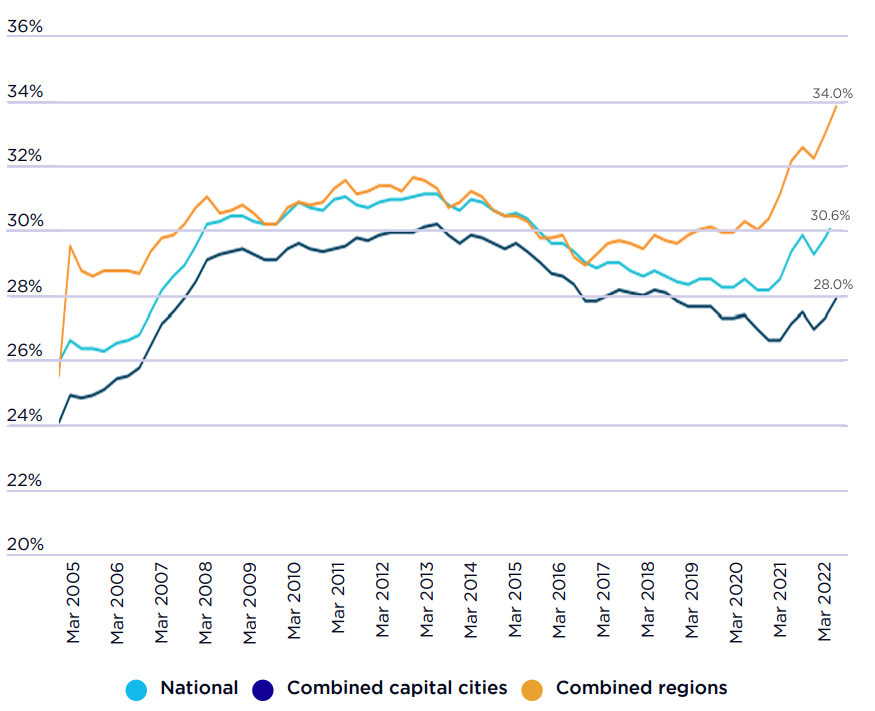
Source - Poverty & Inequality
This graph is also very misleading for the following reasons. Firstly, we will explore how the use of the Median hides the problem for those in disadvantaged situations. (Most disadvantaged persons will have incomes of below the reported median, so rent as a portion of income will be significantly higher for these individuals) Secondly, this data is laggard, missing a year and a half of data. This wouldn't necessarily be a problem, and most of the time is the case when relying on public research. However the last two years the economy has found itself in a highly inflationary environment. So this inflationary pressure is not fully presented as yet. This doesn't account for any qualitative factors either, such as quality of accommodation, which will also be discussed later.
The ability of people to access quality homes is also lowering substantially. Vacancy rates are at their lowest level in twenty years across most major cities.
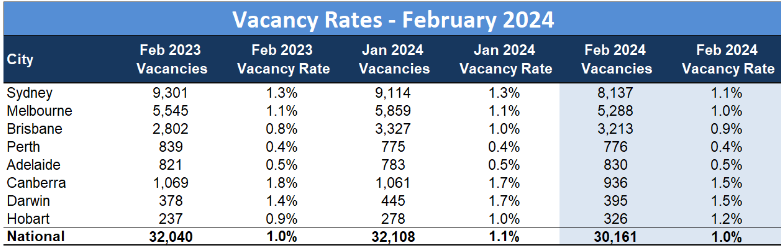
Source - SQM
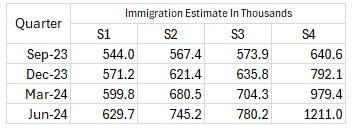
Immigration notably has skyrocketed. December 2019 Immigration peaked at 247,000 net migration (rounded). As at June 2023, net migration is over 100% higher at 518,000 (rounded). Further putting pressure of both home ownership and rental opportunities. This data is also laggard. See the table below for Immigration scenarios based on ABS data. (left to right in order of probability)
New research from Amber Howard "suggests that low-income households are particularly disadvantaged in the private rental sector, having a harder time securing private rental housing (Hoolachan et al.2017), relying on informal options like sub-lets and the “black market” (Grander2021; Gurran, Pill, and Maalsen 2021), facing discrimination, eviction and frequent moves (Cole, Powell, and Sanderson 2016), and for some, experiencing periods of homelessness (Watt 2020). Those who do manage to find private rental housing may rely on undesired shared arrangements (Nasreen and Ruming 2021), besusceptible to higher housing costs (Yates and Milligan 2007), and other sub-optimal housing conditions (Bricocoli and Sabatinelli 2016)."
Some of the reasons are well known. However the scale is hidden amongst the data. The next section of this article will shine a light on these quantitative changes over the past 30 years.
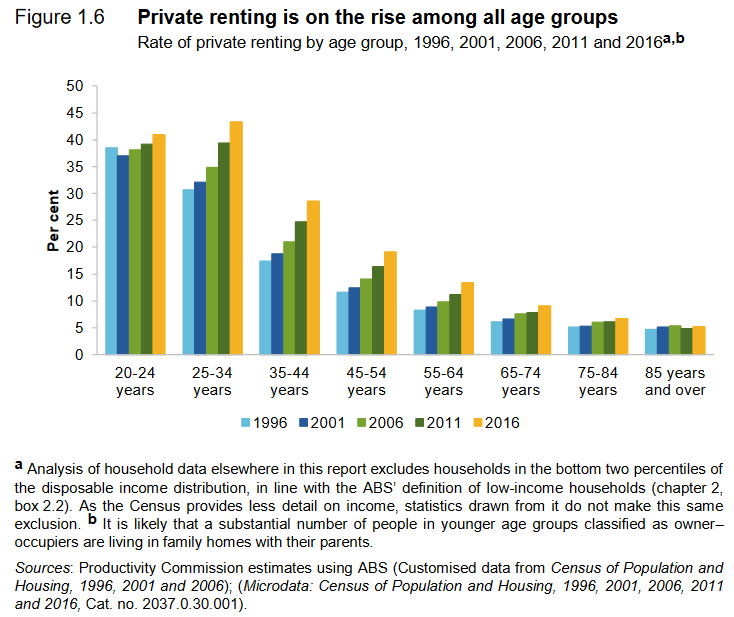
Increased renting for the youth and middle aged cohorts has been a long run trend in Australia. Note the gap between past years 1996 and 2016 for the 3 segments 25 - 34, 35 - 44 & 45 - 54, relative to other years. These populations make up the bulk of Australians population however the below Figure 1.6 demonstrates percentage change.
Unsurprisingly, Fewer renters across these discussed age groups are moving from renting to home ownership. With demographic cohorts 18 - 24 and 35 - 44 suffering a 5.9% and 5.2% (percentage point) drops respectfully since 2001 in their respective cohorts. This actually a near 50% & 35% drops, demonstrating how reporting statistics publicly in certain ways can skew the scale of the problem.
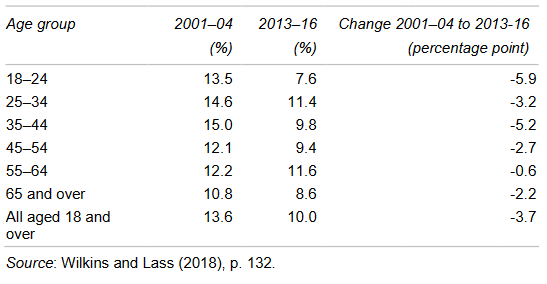
to owner–occupation, by age group
Source listed
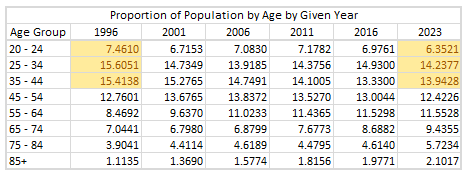
Original analysis reveals that population by age vs proportion of population by age has also changed significantly. The proportion of younger age groups over total population (20 - 24, 25 - 34, & 35 - 44), have all decreased by 1.315%* on average relative to total population. While all three age groups aforementioned in order have grown by 23.50%, 32.35% & 31.21% respectively. See table below. Notice youth groups percentage change is smaller than other groups. Immigration average age tends to be older individuals. (Median age immigrants is 37) Also note the aging population as a percentage change.
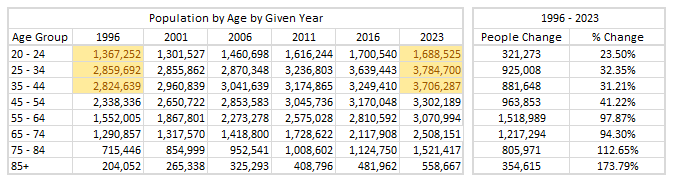
Source - Original Analysis based on ABS Population Data
Everyone votes and fiscal policy is influenced by the people. It is obvious that the changing demographics overtime has left younger generations out. Proportionally, these age groups have changed by 10%, with the 20 - 24 age group shrinking proportionally by nearly 20%.
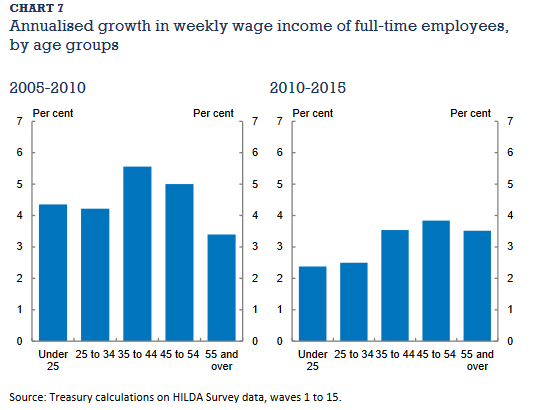
A quick view of wage growth in The analysis of wage growth published by the Australian Government Treasury November 2017 shows a disturbing trend for young people. Note this data is ten years old. Wages of full time employees in younger generations have shrunk the most relatively.
The following outlines the significance of the problems discussed above.
- (Lagging Data) Private renting has increased across all age groups since 1996. (40% increase for 25 - 34 year olds, 130% Increase for 35 - 44 year olds, 50% increase for 45-55 year olds)
- (Lagging Data) Government public housing in the same time has halved. (6% to 3%)
- (Original Estimates) Total number of people have increased, Proportions of youth has declined, who are being adversely affected by increasing rent prices. Explosion in older people getting older, who are also adversely affected.
- (Lagging Data) Proportion of people transitioning to home ownership has declined substantially.
- (Lagging Data) Median household rent increasing. (This data doesn't account for recent inflation changes over the last two years)
- (Lagging Data) Immigration has skyrocket and increasing, this will put further strain on rental vacancies. (along with prices)
- (Private publicly released data) Vacancy rates at all time lows.
- (Lagging Data) Wages of young people disproportionately in decline.
- Government hiding the complexity and size of the problem through the way data is released. All data is substantially laggard.
- Academics have outlined the problems which is being caused, mental health and the generational trend which could result if no fiscal policy changes.